Exercise 3.1
1. Find the range of heights of any ten students of your class.
Solution:-
Let us assume heights (in cm) of 10 students of our class.
= 130, 132, 135, 137, 139, 140, 142, 143, 145, 148
By observing the above mentioned values, the highest value is = 148 cm
By observing the above mentioned values, the lowest value is = 130 cm
Then,
Range of Heights = Highest value – Lowest value
= 148 – 130
= 18 cm
2. Organise the following marks in a class assessment, in a tabular form.
4, 6, 7, 5, 3, 5, 4, 5, 2, 6, 2, 5, 1, 9, 6, 5, 8, 4, 6, 7
(i) Which number is the highest? (ii) Which number is the lowest?
(iii) What is the range of the data? (iv) Find the arithmetic mean.
Solution:-
First, we have to arrange the given marks in ascending order.
= 1, 2, 2, 3, 4, 4, 4, 5, 5, 5, 5, 5, 6, 6, 6, 6, 7, 7, 8, 9
Now, we will draw the frequency table of the given data.
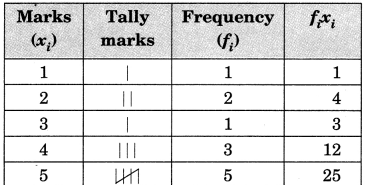
(i) By observing the table clearly, the highest number among the given data is 9.
(ii) By observing the table clearly, the lowest number among the given data is 1.
(iii) We know that, Range = Highest value – Lowest value
= 9 – 1
= 8
(iv) Now we have to calculate Arithmetic Mean,
Arithmetic mean = (Sum of all observations)/ (Total number of observation)
Then,
Sum of all observation = 1 + 2 + 2 + 3 + 4 + 4 + 4 + 5 + 5 + 5 + 5 + 5 + 6 + 6 + 6 + 6 + 7 + 7
+ 8 + 9
= 100
Total Number of Observation = 20
Arithmetic mean = (100/20)
= 5
3. Find the mean of the first five whole numbers.
Solutions:-
The first five Whole numbers are 0, 1, 2, 3, and 4.
Mean = (Sum of first five whole numbers)/ (Total number of whole numbers)
Then,
Sum of five whole numbers = 0 + 1 + 2 + 3 +4
= 10
Total Number of whole numbers = 5
Mean = (10/5)
= 2
∴Mean of first five whole numbers is 2.
4. A cricketer scores the following runs in eight innings:
58, 76, 40, 35, 46, 45, 0, 100. Find the mean score.
Solution:-
Mean score = (Total runs scored by the cricketer in all innings)/ (Total number of innings
Played by the cricketer)
Total runs scored by the cricketer in all innings = 58 + 76 + 40 + 35 + 46 + 45 + 0 + 100
= 400
Total number of innings = 8
Then,
Mean = (400/8)
= 50
∴Mean score of the cricketer is 50.
5. Following table shows the points of each player scored in four games:
| Player | Game 1 | Game 2 | Game 3 | Game 4 |
| A | 14 | 16 | 10 | 10 |
| B | 0 | 8 | 6 | 4 |
| C | 8 | 11 | Did not play | 13 |
Now answer the following questions:
(i) Find the mean to determine A’s average number of points scored per game.
(ii) To find the mean number of points per game for C, would you divide the total points by 3 or by 4? Why?
(iii) B played in all the four games. How would you find the mean?
(iv) Who is the best performer?
Solution:
(i) A’s average number of points scored per game = Total points scored by A in 4 games/
Total number of games
= (14 + 16 + 10 + 10)/ 4
= 50/4
= 12.5 points
(ii) To find the mean number of points per game for C, we will divide the total points by 3. Because C played only 3 games.
(iii) B played in all the four games, so we will divide the total points by 4 to find out the mean.
Then,
Mean of B’s score = Total points scored by B in 4 games/ Total number of games
= (0 + 8 + 6 + 4)/ 4
= 18/4
= 4.5 points
(iv) Now, we have to find the best performer among 3 players.
So, we have to find the average points of C = (8 + 11 + 13)/3
= 32/3
= 10.67 points
By observing, the average points scored A is 12.5 which is more than B and C.
Clearly, we can say that A is the best performer among three.
6. The marks (out of 100) obtained by a group of students in a science test are 85, 76,
90, 85, 39, 48, 56, 95, 81 and 75. Find the:
(i) Highest and the lowest marks obtained by the students.
(ii) Range of the marks obtained.
(iii) Mean marks obtained by the group.
Solution:-
First we have to arrange the marks obtained by a group of students in a science test in an ascending order,
= 39, 48, 56, 75, 76, 81, 85, 85, 90, 95
(i) The highest marks obtained by the student = 95
The lowest marks obtained by the student = 39
(ii) We know that, Range = Highest marks – Lowest marks
= 95 – 39
= 56
(iii) Mean of Marks = (Sum of all marks obtained by the group of students)/
(Total number of marks)
= (39 + 48 + 56 + 75 + 76 + 81 + 85 + 85 + 90 + 95)/ 10
= 730/10
= 73
7. The enrolment in a school during six consecutive years was as follows:
1555, 1670, 1750, 2013, 2540, 2820.
Find the mean enrolment of the school for this period.
Solution:-
Mean enrolment = Sum of all observations/ Number of observations
= (1555 + 1670 + 1750 + 2013 + 2540 + 2820)/ 6
= (12348/6)
= 2058
∴The mean enrolment of the school for this given period is 2058.
8. The rainfall (in mm) in a city on 7 days of a certain week was recorded as follows:
| Day | Mon | Tue | Wed | Thurs | Fri | Sat | Sun |
| Rainfall(in mm) | 0.0 | 12.2 | 2.1 | 0.0 | 20.5 | 5.5 | 1.0 |
(i) Find the range of rainfall in the above data.
(ii) Find the mean rainfall for the week.
(iii) On how many days was the rainfall less than the mean rainfall.
Solution:-
(i) Range of rainfall = Highest rainfall – Lowest rainfall
= 20.5 – 0.0
= 20.5 mm
(ii) Mean of rainfall = Sum of all observations/ Number of observation
= (0.0 + 12.2 + 2.1 + 0.0 + 20.5 + 5.5 + 1.0)/ 7
= 41.3/7
= 5.9 mm
(iii) We may observe that for 5 days i.e. Monday, Wednesday, Thursday, Saturday and Sunday the rainfall was less than the average rainfall.
9. The heights of 10 girls were measured in cm and the results are as follows:
135, 150, 139, 128, 151, 132, 146, 149, 143, 141.
(i) What is the height of the tallest girl? (ii) What is the height of the shortest girl?
(iii) What is the range of the data? (iv) What is the mean height of the girls?
(v) How many girls have heights more than the mean height.
Solution:-
First we have to arrange the given data in an ascending order,
= 128, 132, 135, 139, 141, 143, 146, 149, 150, 151
(i) The height of the tallest girl is 151 cm
(ii) The height of the shortest girl is 128 cm
(iii) Range of given data = Tallest height – Shortest height
= 151 – 128
= 23 cm
(iv) Mean height of the girls = Sum of height of all the girls/ Number of girls
= (128 + 132 + 135 + 139 + 141 + 143 + 146 + 149 + 150
+ 151)/ 10
= 1414/10
= 141.4 cm
(v)Number of girls having more height than the mean height
= 150, 151, 146, 149 and 143 = 5 girls
Exercise 3.2
1. The scores in mathematics test (out of 25) of 15 students is as follows:
19, 25, 23, 20, 9, 20, 15, 10, 5, 16, 25, 20, 24, 12, 20
Find the mode and median of this data. Are they same?
Solution:-
Arranging the given scores in an ascending order, we get
5, 9, 10, 12, 15, 16, 19, 20, 20, 20, 20, 23, 24, 25, 25
Mode,
Mode is the value of the variable which occurs most frequently.
Clearly, 20 occurs maximum number of times.
Hence, mode of the given sores is 20
Median,
The value of the middle-most observation is called the median of the data.
Here n = 15, which is odd.
Where, n is the number of the students.
∴median = value of ½ (n + 1)th observation.
= ½ (15 + 1)
= ½ (16)
= 16/2
= 8
Then, value of 8th term = 20
Hence, the median is 20.
Yes, both the values are same.
2. The runs scored in a cricket match by 11 players is as follows:
6, 15, 120, 50, 100, 80, 10, 15, 8, 10, 15
Find the mean, mode and median of this data. Are the three same?
Solution:-
Arranging the runs scored in a cricket match by 11 players in an ascending order, we get
6, 8, 10, 10, 15, 15, 15, 50, 80, 100, 120
Mean,
Mean of the given data = Sum of all observations/ Total number of observations
= (6 + 8 + 10 + 10 + 15 + 15 + 15 + 50 + 80 + 100 + 120)/ 11
= 429/11
= 39
Mode,
Mode is the value of the variable which occurs most frequently.
Clearly, 15 occurs maximum number of times.
Hence, mode of the given sores is 15
Median,
The value of the middle-most observation is called the median of the data.
Here n = 11, which is odd.
Where, n is the number of players.
∴median = value of ½ (n + 1)th observation.
= ½ (11 + 1)
= ½ (12)
= 12/2
= 6
Then, value of 6th term = 15
Hence, the median is 15.
No, these three are not same.
3. The weights (in kg.) of 15 students of a class are:
38, 42, 35, 37, 45, 50, 32, 43, 43, 40, 36, 38, 43, 38, 47
(i) Find the mode and median of this data.
(ii) Is there more than one mode?
Solution:-
Arranging the given weights 15 students of a class in an ascending order, we get
32, 35, 36, 37, 38, 38, 38, 40, 42, 43, 43, 43, 45, 47, 50
(i) Mode and Median
Mode,
Mode is the value of the variable which occurs most frequently.
Clearly, 38 and 43 both occurs 3 times.
Hence, mode of the given weights are 38 and 43.
Median,
The value of the middle-most observation is called the median of the data.
Here n = 15, which is odd.
Where, n is the number of the students.
∴median = value of ½ (n + 1)th observation.
= ½ (15 + 1)
= ½ (16)
= 16/2
= 8
Then, value of 8th term = 40
Hence, the median is 40.
(ii) Yes, there are 2 modes for the given weights of the students.
4. Find the mode and median of the data: 13, 16, 12, 14, 19, 12, 14, 13, 14
Solution:-
Arranging the given data in an ascending order, we get
= 12, 12, 13, 13, 14, 14, 14, 16, 19
Mode,
Mode is the value of the variable which occurs most frequently.
Clearly, 14 occurs maximum number of times.
Hence, mode of the given data is 14.
Median,
The value of the middle-most observation is called the median of the data.
Here n = 9, which is odd.
Where, n is the number of the students.
∴median = value of ½ (9 + 1)th observation.
= ½ (9 + 1)
= ½ (10)
= 10/2
= 5
Then, value of 5th term = 14
Hence, the median is 14.
5. Tell whether the statement is true or false:
(i) The mode is always one of the numbers in a data.
Solution:-
The statement is given above is true.
Because, Mode is the value of the variable which occurs most frequently in the given data.
Hence, mode is always one of the numbers in a data.
(ii) The mean is one of the numbers in a data.
Solution:-
The statement is given above is false.
Because, mean is may be or may not be one of the number in a data.
(iii) The median is always one of the numbers in a data.
Solution:-
The statement is given above is true.
Because, median is the value of the middle-most observation in the given data while arranged in ascending or descending order.
Hence, median is always one of the numbers in a data
(iv) The data 6, 4, 3, 8, 9, 12, 13, 9 has mean 9.
Solution:-
Mean = Sum of all given observations/ number of observations
= (6 + 4 + 3 + 8 + 9 + 12 + 13 + 9)/8
= (64/8)
= 8
Hence, the given statement is false.
Exercise 3.3
Question 1.
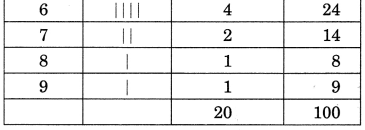
Use the bar graph to answer the following questions.
(a) Which is the most popular pet?
(b) How many students have dog as a pet?
Solution:
From the given bar graph in figure, we have
(a) Cats are the most popular pet among the students.
(b) 8 students have dog as a pet animal.
Question 2.
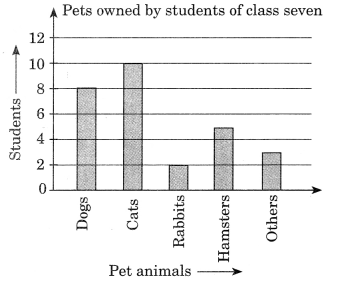
Read the bar graph which shows the number of books sold by a bookstore during five consecutive years and answer the following questions:
(i) About how many books were sold in 1989, 1990, 1992?
(ii) In which year were about 475 books sold? About 225 books sold?
(iii) In which year were fewer than 250 books sold?
(iv) Can you explain how you would estimate the number of books sold in 1989?
Solution:
From the given bar graph, we have
(i) Number of books sold in the year 1989 is about 180, in 1990 is about 490 and in 1992 is about 295.
(ii) About 475 books were sold in 1990. About 225 books were sold in the year 1992.
(iii) Fewer than 250 books were sold in the years 1989 and 1992.
(iv) On y-axis, the line is divided into 10 small parts of 10 books each. So, we can estimate the number of books sold in 1989 is about 180.
3. Number of children in six different classes are given below. Represent the data on a bar graph.
| Class | Fifth | Sixth | Seventh | Eighth | Ninth | Tenth |
| Number of Children | 135 | 120 | 95 | 100 | 90 | 80 |
(a) How would you choose a scale?
(b) Answer the following questions:
(i) Which class has the maximum number of children? And the minimum?
(ii) Find the ratio of students of class sixth to the students of class eight.
Solution:-
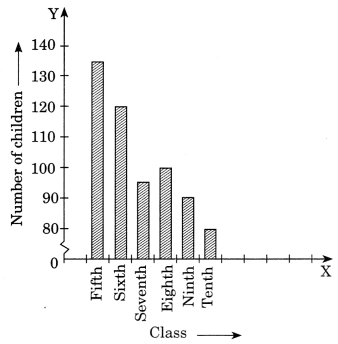
(a) We will take the scale as 1 unit = 10 children. Because, we can represent a better and clear difference among the number of students of class 7th and class 9th.
(b) (i) Class 5th has the maximum number of children i.e. 135 and class 7th has the minimum number of children i.e. 95.
(ii) The total number of students in class 6th is 120 and the total number of students in class 8th is 100
Then,
Ratio between the number of students of class 6th and 8th,
= (120/100)
= 6/5
= 6: 5
4. The performance of a student in 1st Term and 2nd Term is given. Draw a double bar graph choosing appropriate scale and answer the following:
| Subject | English | Hindi | Maths | Science | S. Science |
| 1st Term (M.M. 100) | 67 | 72 | 88 | 81 | 73 |
| 2nd Term (M.M. 100) | 70 | 65 | 95 | 85 | 75 |
(i) In which subject, has the child improved his performance the most?
(ii) In which subject is the improvement the least?
(iii) Has the performance gone down in any subject?
Solution:-
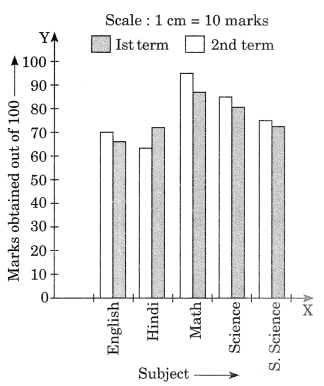
(i) In Math, the performance of the students improved the most.
(ii) In social science, the performance of the students improved the least.
(iii) Yes, in Hindi the performance of the students has gone down.
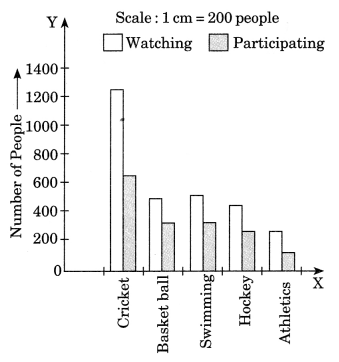
5. Consider this data collected from a survey of a colony.
| Favourite Sport | Cricket | Basket Ball | swimming | Hockey | Athletics |
| Watching | 1240 | 470 | 510 | 430 | 250 |
| Participating | 620 | 320 | 320 | 250 | 105 |
(i) Draw a double bar graph choosing an appropriate scale.
What do you infer from the bar graph?
(ii) Which sport is most popular?
(iii) Which is more preferred, watching or participating in sports?
Solution:-(i) The above bar graph depicts the number of people who are watching and who are participating in sports.
(ii) Cricket is the most popular sport.
(iii) Watching the sports is more preferred by the people.
6. Take the data giving the minimum and the maximum temperature of various cities given in the beginning of this Chapter (Table 3.1). Plot a double bar graph using the data and answer the following:
(i) Which city has the largest difference in the minimum and maximum temperature on the given date?
(ii) Which is the hottest city and which is the coldest city?
(iii) Name two cities where maximum temperature of one was less than the minimum temperature of the other.
(iv) Name the city which has the least difference between its minimum and the maximum temperature.
Solution:-
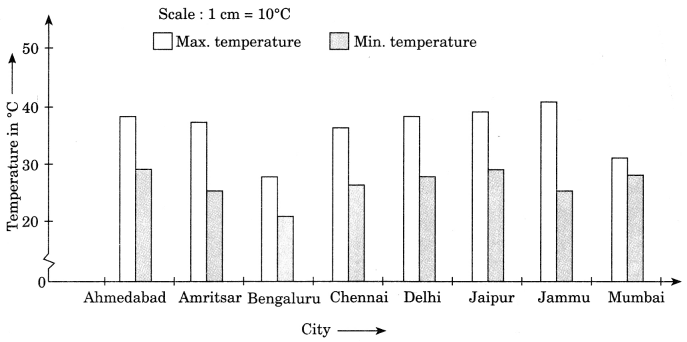
(i) Jammu has the largest difference between the maximum and minimum temperature i.e. 41°C – 26°C = 15°C
(ii) Hottest city is Jammu with 41°C temperature and coldest city is Bengaluru with 21°C temperature.
(iii)
- Bengaluru having its maximum temperature 28°C is less than the minimum temperature 29°C in Ahmedabad.
- Bengaluru having its maximum tem-perature 28°C is less than the maximum temperature 29°C in Jaipur.
(iv) Mumbai has the least difference between its minimum and maximum temperatures i.e. 32°C – 27°C = 5°C
Exercise 3.4
1. Tell whether the following is certain to happen, impossible, can happen but not certain.
(i) You are older today than yesterday.
Solution:-
It is certain to happen.
(ii) A tossed coin will land heads up.
Solution:-
It can happen but not certain.
(iii) A die when tossed shall land up with 8 on top.
Solution:-
It is impossible. Because, there are only six faces on a die is marked as 1, 2, 3, 4, 5, and 6 on it.
(iv) The next traffic light seen will be green.
Solution:-
It can happen but not certain.
(v) Tomorrow will be a cloudy day.
Solution:-
It can happen but not certain.
2. There are 6 marbles in a box with numbers from 1 to 6 marked on each of them.
(i) What is the probability of drawing a marble with number 2?
Solution:-
From the question, it is given that
There are 6 marbles in the box with numbers from 1 to 6 are marked.
Probability of drawing a marble with number 2 = Number of favourable outcomes/
Number of possible outcomes
= (1/6)
(ii) What is the probability of drawing a marble with number 5?
Solution:-
From the question, it is given that
There are 6 marbles in the box with numbers from 1 to 6 are marked.
Probability of drawing a marble with number 5 = Number of favourable outcomes/
Number of possible outcomes
= (1/6)
3. A coin is flipped to decide which team starts the game. What is the probability that your team will start?
Solution:-
A coin has two faces one is Head and other one is Tail.
Now, one team can choose either Head or Tail.
Probability of our team starts first= Number of favourable outcomes/
Number of possible outcomes
= 1/2
