Introduction to Statistics
– A study dealing with the collection, presentation and interpretation and analysis of data is called as statistics.
Data
- Facts /figures numerical or otherwise collected for a definite purpose is called as data.
- data collected first-hand data:- Primary
- Secondary data: Data collected from a source that already had data stored
Frequency
– The number of times a particular instance occurs is called frequency in statistics.
Ungrouped data
Ungrouped data is data in its original or raw form. The observations are not classified in groups.
Grouped data
In grouped data, observations are organized in groups.
Class Interval
- The size of the class into which a particular data is divided.
- E.g divisions on a histogram or bar graph.
- Class width = upper class limit – lower class limit
Regular and Irregular class interval
- Regular class interval: When the class intervals are equal or of the same sizes.
- E.g 0-10, 10-20, 20-30….. 90-100
- Irregular class interval: When the class intervals are of varying sizes.
- E.g 0-35, 35-45, 45-55, 55- 80, 80-90, 90-95, 95-100
Frequency table
– A frequency table or distribution shows the occurrence of a particular variable in a tabular form.
Sorting
- Raw data needs to be sorted in order to carry out operations.-
- Sorting ⇒ ascending order or descending order
Ungrouped frequency table
– When the frequency of each class interval is not arranged or organised in any manner.
Grouped frequency table
– The frequencies of the corresponding class intervals are organised or arranged in a particular manner, either ascending or descending.
Graphical Representation of Data: There is another way of representing data which is called graphical representation of data. The main graphical representations are as follows
(i) Bar graphs: A bar graph is a pictorial representation of data in which usually bars of uniform width are drawn with equal spacing between them on one axis (say the x-axis), depicting the variable. The values of the variable are shown on the other axis (say the y-axis) and heights of the bars depends on the values of the variable.
(ii) Histogram: A histogram is a graphical representation of a grouped frequency distribution with continuous classes. The steps of. construction are as follows
- We represent along x-axis the class limits and frequencies along y-axis on a suitable scale.
- We now draw rectangles (or rectangular bars) of width equal to the class size and lengths according to the frequencies of the corresponding class intervals.
Since there are no gaps in between consecutive rectangles, the resultant graph appears like a solid figure. This is called a histogram.
Note:
- If the first class interval is not starting from zero, then we show it on the graph by marking a kink or a break on the axis.
- In’a histogram, the area of the rectangles eracted are proportional to the corresponding frequencies.
- If the widths of the rectangles are varying, then we need to make certain modifications in the lengths of the rectangles, so that the areas are again proportional to the frequencies. The steps to be followed for this are as given below
- Select a class interval with minimum class size.
- Then, the lengths of the rectangles are modified to the proportional to the minimum class size. These lengths are called as ‘Lengths proportional to the minimum class size.’
(iii) Frequency polygon: For an ungrouped distribution, the frequency polygon is obtained by plotting points with abscissa as the variate values and the ordinate as the corresponding frequencies and joining the plotted points by means of straight lines. For a grouped frequency distribution, the abscissa of points are mid-values of the class-intervals. For equal class intervals, the frequency polygon can be obtained by joining the middle points of the upper sides of the adjacent rectangles of the histogram by means of straight lines.
Note: If both histogram and frequency polygon are to be drawn, then it is advisable first to draw a histogram and then frequency polygon.
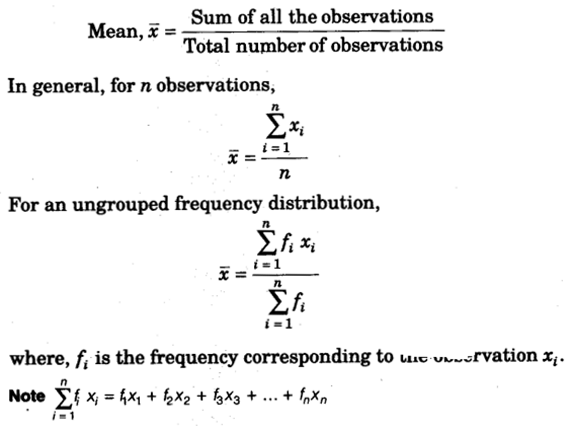
Average
– The average of a number of observations is the sum of the values of all the observations divided by the total number of observations.
Mean
Mode
- The most frequently occurring observation is called the mode.
- The class interval with the highest frequency is the modal class
Median
- Value of the middlemost observation.
- If n(number of observations) is odd, Median =[(n+1)/2]th observation.
- If n is even, the Median is the mean or average of (n/2)th and [(n+1)/2]th observation.
