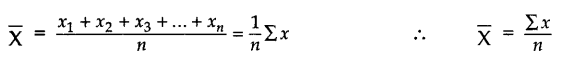
MEAN (AVERAGE): Mean [Ungrouped Data] – Mean of n observations, x1, x2, x3 … xn, is
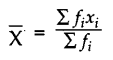
MEAN [Grouped Data]: The mean for grouped data can be found by the following three methods:
(i) Direct Mean Method:
Class Mark =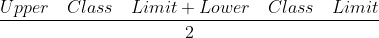
Note: Frequency of a class is centred at its mid-point called class mark.
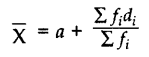
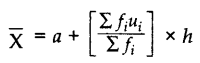
(ii) Assumed Mean Method: In this, an arbitrary mean ‘a’ is chosen which is called, ‘assumed mean’, somewhere in the middle of all the values of x
(iii) Step Deviation Method:
MEDIAN: Median is a measure of central tendency which gives the value of the middle-most observation in the data.
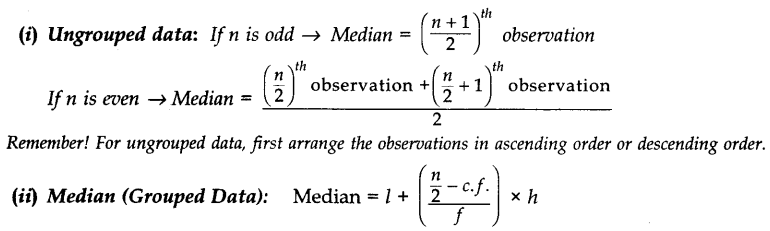
l = Lower limit of median class; n = Number of observations; f = Frequency of median class; c.f. = Cumulative frequency of preceding class; h = Class size
(iii) Representing a cumulative frequency distribution graphically as a cumulative frequency curve, or an ogive of the less than type and of the more than type. The median of grouped data can be obtained graphically as the x-coordinate of the point of intersection of the two ogives for this data.
Mode:
(i) Ungrouped Data: The value of the observation having maximum frequency is the mode.
(ii) Grouped Data:
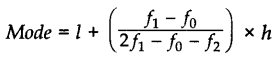
l = Lower limit of modal class; f1 = Frequency of modal class; f0 = Frequency of the class preceding the modal class; f2 = Frequency of the class succeeding the modal class; h = Size of class interval. c.f. = Cumulative frequency of preceding class; h = Class size
Mode = 3 Median – 2 Mean
ncert solution